Enhancements in this version:
Bid/Offer Edge in Strategy Solver Window
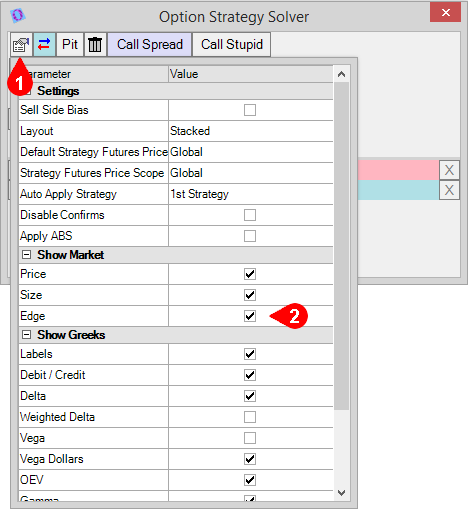
The option strategy solver window can now display bid and offer edge as click-tradable buttons. To enable this feature, click the properties button (1) in the upper left of the strategy solver, then place a check in the box next to "Edge" in the "Show Market" group. Note that if there is not a market on one or both sides, these boxes will show "--" instead of being empty.


Bid/Offer Edge Columns in Option Strategies Window
The option strategies window can now show bid and offer edge columns. This is useful for quickly determining the best trading opportunities from a list of spreads. You can also click trade directly from these new columns. To enable these columns, click the properties button (1) in the upper left of the option strategies window, click the plus sign next to "Market Info" (2), then place checks in the boxes for "Bid Edge" and "Offer Edge" (3).

Option Series Import and Export
The model management window now offers the ability to export and import volatility to and from Excel. Clicking the export button (1) will create an Excel file that contains all the volatility levels for that particular option series. Within this Excel file, you can click through the different tabs to see each month's volatility levels at each strike. You can also make changes to this file, save it, and import it back into T4 using the import button (2) in the model management window.

P&L in Portfolio Analysis Window
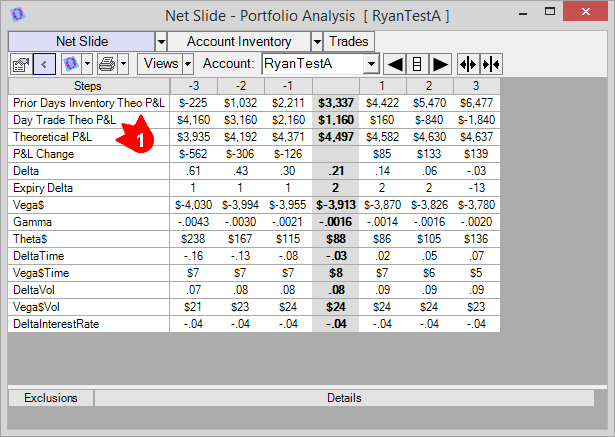
The portfolio analysis window now shows theoretical profit and loss at each step on all slide reports. "Prior Days Inventory Theo P&L" (1) shows the theoretical profit and loss that is a result of any position carried over from the previous day. This is calculated based on a snapshot of the analysis series at the end of the prior day against that day's futures settles. "Day Trade Theo P&L" (1) shows the theoretical profit and loss based only trades in the current day as compared to the current theoretical values. "Theo P&L" (1) aggregates the two to create a complete picture of the profit and loss for the entire position.

To enable the P&L rows in the portfolio analysis window, click the main properties button in the grey bar. On the left side of the main properties window, click "Options" (1), then "Portfolio Analysis" (2). On the right side, click the name of the view (3) you would like to add the P&L to, then click the box with three dots to the right of the view name (4). In this window you can now add checks (5) to any of the P&L items you would like.
