Note: This new version requires Windows XP Service Pack 2 or newer operating system!Market Profile now Included with Charting
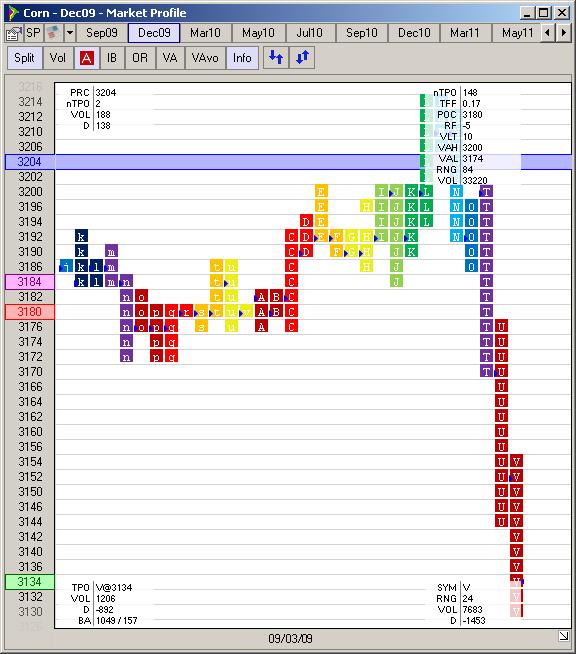
Users with Charting permission can now access Market Profile at no additional charge!


You can open a market profile window via the new window menu item on the main window or by right clicking on a quoteboard market.
Some of the features of Market Profile are:
- Real-Time and Historical data
- Custom Session Times - Customizable letter sequences and start letter
- Letter shading based on time or volume
- Configurable time per letter
- Volume per price
- Shows Initial Balance (IB), Opening Range (OR), Value Area (VA), Volume Value Area (VAvo), Point of Control (POC) and Volume Point of Control (POCvo) directly on the chart
Specify the Time Range for a Trading Day
On Charts and Market Profile you can now set the time range that you want to see for each trading day, e.g. you can set the E-Mini S&P 500 to only show from 8:30am to 3pm (Chicago time). This will hide the overnight session from the chart and applies to all bar intervals, including day bars.
To set this time range go to the properties window of the chart, go to the 'Price Bars' tab and click the '...' button on the 'Session Time Range' option. Click 'Custom' and enter the time range you want in 24hr format in Chicago time. e.g. enter 08:30 and 15:00 for the S&P example just given.
Note: Setting this time range only effects that specific window so if you want a time range set on multiple charts for the same contract then you need to set it on each individually.
Migration to Microsoft .Net Framework 2
- Adds support for running in 64bit.
- Updated developer API and documentation now included in Simulator install - see T4 Simulator start menu folder.
Support for Chinese language